By Daniel Sabet · Cannabis CFO & Financial Advisor, GreenGrowth CPAs · 280E, Tax Strategy & Growth Planning · Los Angeles, CA | Published June 2026 | Cannabis Operations & Technology
AI for cannabis retail operations is no longer a future capability reserved for enterprise-scale multi-state operators. The tools exist today, they connect directly to your POS, and in the first four dispensaries currently running BudMetrics, the cannabis retail analytics platform built by GreenGrowth CPAs, the pattern is consistent: the biggest financial leaks are not coming from competitors. They are coming from inside the building. Slow-moving inventory nobody noticed, discount strategies eroding margin on customers who were coming in anyway, and purchase orders built on vendor relationships instead of actual sell-through data. This article breaks down exactly how AI is solving each of these problems, with real numbers from real stores.
QUICK ANSWER
AI tools like BudMetrics help cannabis retailers recover $15,000 to $20,000 per month in gross profit by automating inventory management, optimizing purchase orders at the SKU level, sharpening discount strategy, and delivering daily business intelligence reports, all without adding headcount. The most impactful metric to track is average basket size, not margin percentage.
At a Glance: AI for Cannabis Retail Operations
- What it is: AI-powered analytics platforms that connect to dispensary POS systems and deliver automated daily insights on inventory, purchasing, discounts, pricing, and competitor activity.
- Who it applies to: Single-location dispensaries and multi-store operators in all legal cannabis markets, including California, New York, New Jersey, Minnesota, and Delaware.
- Key constraint: AI tools require POS integration to function. The quality of insights depends on the consistency and completeness of your POS data.
- Primary mistake: Focusing on competitor benchmarking before fixing internal operations. Internal optimization almost always produces faster ROI.
- Relevant threshold: Target 41–45% gross margin and $60–$65 average basket size. These two numbers, managed consistently, outperform most aggressive growth campaigns.
- GreenGrowth’s role: We built BudMetrics for the retailers we serve and conduct biweekly auditing calls with every client on the platform.
Learn how GreenGrowth CPAs works with cannabis retailers →
Fix Your Own House Before Worrying About Competitors
This is the starting point for every AI-powered operations conversation. Competitor data is useful context, but it is not the foundation of a profitable dispensary. The operators doing best are the ones who obsess over internal metrics first: What is your average basket size? Which SKUs are generating your gross profit and which ones are consuming your cash? Where are your customers loyal regardless of discount, and where are you actually influencing purchase decisions?
BudMetrics was built on this principle. The platform analyzes your POS data, order history, and discount performance before it surfaces a single competitor comparison. In nearly every financial review we conduct at GreenGrowth CPAs, the internal picture reveals more actionable opportunity than the external one. Fix the inside first. Then use competitor data to calibrate.
💬 The Conversation Worth Having
Most dispensary owners I meet have a clear picture of what competitors are doing. Very few can tell me their exact average basket size by day of week, or which five SKUs are responsible for 40% of their gross profit. That information asymmetry is where AI creates its fastest wins.
The Inventory Problem Most Dispensaries Do Not Know They Have
Here is a pattern that appears repeatedly in cannabis retail. Two stores, very different revenue, almost identical SKU counts. Store A generates $150,000 per month in gross profit and holds approximately 1,300 SKUs. Store B generates $500,000 per month. Also holding 1,300 SKUs. The smaller store’s team argued their situation was justified by market breadth. What the data showed was a slow-mover problem compounding quietly for months.
Products were getting purchased, moved to backstock, and forgotten. New orders kept arriving for products already sitting unsold. Items approaching expiration were not getting flagged until they became write-offs. The result: $15,000 to $20,000 per month in gross profit sitting idle or lost. This is not a staffing problem. It is a data visibility problem.
What BudMetrics does: It connects directly to your POS, analyzes your full inventory daily, and delivers an automated report every morning at 8 AM before your store opens. Each report flags expiring items within 30 days, backstock products ready to move to the sales floor, slow movers flagged for discount consideration, and ordering patterns showing you are buying products already sitting unsold.
No manual SKU-by-SKU review. No dedicated staff pulling reports from the POS. A two-minute read before opening, and the action items are clear. Moving even a fraction of that backstock to the floor consistently compounds significantly over a quarter.
▶ Benchmark: Inventory Performance by Store Size
Unoptimized Store
- $150K/month gross profit
- 1,300 SKUs held
- High slow-mover concentration
- Expiry write-offs untracked
- $15K–$20K/month recoverable leak
AI-Optimized Store
- $500K/month gross profit
- 1,300 SKUs held (same count)
- Daily automated inventory alerts
- Expiry flagged 30 days in advance
- Backstock actively cycled to floor
Do you know exactly which SKUs are draining your gross profit this month?
Get a Free Business Review →AI-Powered Purchasing: Stop Buying What Is Not Selling
Most buyers have a relationship with vendors that is stronger than their relationship with their sell-through data. A popular brand is performing well overall, so the order stays the same cycle after cycle. What gets missed is that within that brand, four or five SKUs carry the revenue while the other five sit in backstock. Every repeat order deepens the problem.
How the tool works: When a vendor sends an order form, you upload it into BudMetrics with your budget parameters. You can specify total spend requirements per vendor and category-level allocations (for example, $5,000 in flower, $2,000 in pre-rolls). The system evaluates each SKU against your actual sales history and current inventory levels and returns a recommended order optimized for your budget, focused on the SKUs your customers actually buy, with a projected gross profit from the buy.
If you are ordering a product already sitting in backstock, the system flags it before the purchase order goes through. The Pareto principle applies here in a nuanced way. It is not simply that 20% of SKUs drive 80% of revenue. Within your top-performing brands, there are concentration effects at the individual SKU level that most operators never quantify. AI does this automatically, every time you prepare an order. The money you save on a bad buy is margin you keep. It is often worth more than an equivalent increase in sales.
Related resource: Learn how GreenGrowth CPAs structures cannabis financial operations →
Smarter Promotions: Why Most Discount Strategies Are Hurting Operators
Cannabis retail is one of the most promotion-dependent industries in consumer goods. With 15 stores in a five-mile radius in many markets, operators feel they must compete on price. The problem is that many are discounting customers who would have come in at full price. Research from BudMetrics store data shows that 30 to 40 percent of a store’s customer base are loyal repeat buyers who are not price-sensitive in the way that occasional buyers are. Blanket discount strategies hand margin away to your most reliable customers without generating any incremental revenue.
How AI approaches this differently: BudMetrics analyzes day-of-week performance across the past 16 to 17 months, competitor promotions running the same day (pulled daily from nearby stores), current live inventory levels and what needs to move, and your historical discount sweet spot for each category and brand.
The output is a set of promotion options broken down by type: direct brand discounts, category discounts across flower, vapes, or pre-rolls, or bundle offers based on live inventory. Steep discounts at 45 to 50 percent on healthy products can actually backfire by signaling to customers that something is wrong with the product. BudMetrics helps operators find the effective range before they give too much away. Fridays are your busiest days. Those customers are coming regardless. That is exactly where blanket discounting costs you the most.
The Metric That Actually Makes Cannabis Retailers More Money
Margin percentage is not the number that grows your business. Average basket size is. Here is the math too many operators are not running. If your average ticket is $50 at a 50 percent margin and you see 1,000 customers per month, your gross profit is $25,000. If you increase the average basket to $70 at a 42 percent margin, still within the healthy 41 to 45 percent range for cannabis retail, your gross profit climbs to $29,400. That is $4,400 per month more without adding a single new customer. Scaled over a year, that is more than $52,000 in additional gross profit from a pricing discipline shift, not from a marketing campaign or customer acquisition spend.
BudMetrics includes a pricing and MSRP rating tool that lets operators see margin by product and run what-if scenarios. What happens to category-level margin if you apply a 30 percent discount to a particular brand? The platform also integrates directly with Dutchie’s POS so that price changes made in BudMetrics update inventory and the store’s website simultaneously. No manual reconciliation required. The benchmarks worth tracking: keep margin in the 41 to 45 percent range and push average basket above $60 to $65. These two numbers, managed consistently, produce better financial outcomes than most aggressive growth strategies we have seen in this industry.
Want to find your basket size sweet spot? We usually identify the gap in the first conversation.
Book a Strategy Call →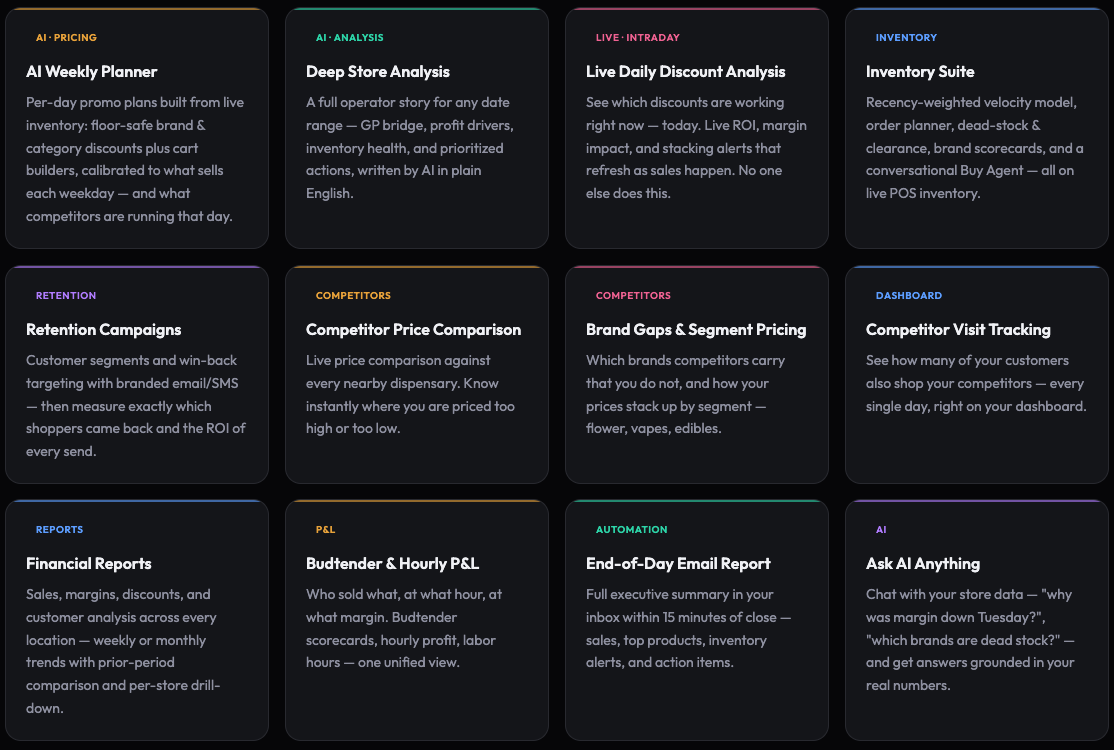
The full BudMetrics feature set, covering inventory, purchasing, discount strategy, pricing, and daily reporting in one platform.
Daily Business Intelligence: The End-of-Day Report That Replaces Hours of POS Review
Cannabis operators are often their own analysts by necessity. After closing, they are pulling reports, reviewing daily sales, comparing to last week, trying to understand what drove a slow Tuesday or a strong Friday. This is time-consuming, inconsistent, and usually done when the operator is already exhausted from a full day on the floor.
BudMetrics generates an automated end-of-day report within 15 minutes of store close. The report compares that day’s performance against the same day for the previous four weeks, same-day seasonality adjusted, and surfaces what went right and what went wrong, where gross profit was gained or lost relative to the baseline, what likely drove new customer traffic, and factors that may explain a slow day including discount timing, inventory gaps, and competitor activity. The report takes two minutes to read. For a multi-location operator, this is the difference between having a system and reacting to problems after they compound. For a single-store operator, it is the closest thing to having a data analyst on staff without the payroll expense.
Competitor Intelligence That Is Actually Useful
Once the internal picture is clean, competitor data becomes genuinely useful context rather than noise. BudMetrics pulls live product listings and promotions from five to six nearby competitor stores every day. This allows operators to make pricing decisions with real market data rather than assumptions. If competitors are consistently pricing 10 percent below you in a category, that is a signal worth acting on. If you are priced below the market without realizing it, you have room to recover margin without losing a single customer.
The comparison is structured to avoid the apples-to-oranges problem. Operators select by product category and weight segment, comparing 3.5-gram flower to 3.5-gram flower, vape carts by size and type, so the pricing intelligence is meaningful. If you are priced above the market, you need to revisit your strategy. If you are priced below, even a 5 to 10 percent adjustment can recover meaningful margin without losing competitive position. The key principle is sequence: internal optimization first. Competitor benchmarking as a calibration tool once your own operations are clean.
KEY TAKEAWAYS
- › Slow-mover inventory is the most common and most recoverable source of gross profit loss in cannabis retail, often $15,000 to $20,000 per month.
- › AI-powered purchase optimization evaluates orders at the SKU level, not just the brand level, preventing repeat buys of products already sitting unsold.
- › 30 to 40 percent of dispensary customers are loyal buyers who purchase at full price. Blanket discounting gives margin away to the people you do not need to incentivize.
- › The two benchmarks that matter: 41–45% gross margin and $60–$65+ average basket size. Basket size growth is worth more than margin percentage improvement at equal customer counts.
- › Automated daily reporting replaces manual POS analysis and provides consistent, same-day-adjusted performance comparisons within 15 minutes of store close.
- › Internal optimization always comes before competitor benchmarking. Fix your own operations first, then use competitor pricing data as a calibration tool.
Frequently Asked Questions
BudMetrics currently integrates directly with Dutchie, one of the most widely used cannabis POS platforms in the United States. The integration allows price changes, inventory updates, and discount configurations made inside BudMetrics to sync automatically with your Dutchie POS and your dispensary’s website without manual reconciliation.
Expanding POS integrations is an active part of the BudMetrics product roadmap. If your store runs a different POS system, reach out through GreenGrowth CPAs to discuss compatibility options and timeline for your specific platform.
Yes. BudMetrics is trained on data from all stores on the platform, so it can generate product recommendations and inventory guidance for new stores based on aggregate performance patterns from similar market types, even before your own sales history builds up. For new dispensaries, the most immediate value comes from purchase optimization and assortment guidance, helping you avoid stocking slow movers from day one.
As your store accumulates sales data over the first 90 to 120 days, the AI becomes significantly more precise because it can analyze your specific customer base, day-of-week patterns, and product preferences. The longer a store runs on the platform, the more accurate and store-specific the recommendations become.
BudMetrics structures competitor price comparisons by product category and weight segment. When you want to benchmark flower pricing, you select the category (flower) and the segment (for example, 3.5 grams), and the system compares only equivalent products at equivalent weights. Vape carts are compared by type and size, pre-rolls by quantity and weight. This prevents distorted comparisons between a premium 3.5g product and an economy bulk option.
You can also drill down to see exact product names and prices from each competitor location, not just aggregate ranges. This makes the competitor intelligence actionable at the SKU level, which is where pricing decisions actually get made on the floor.
Based on the data GreenGrowth CPAs has reviewed across cannabis retailers in California, New York, New Jersey, Minnesota, and Delaware, a gross margin of 41 to 45 percent represents the healthy operating range for most dispensary models. Margins above 50 percent are often accompanied by above-market pricing that suppresses basket size and transaction frequency. Margins below 40 percent typically indicate pricing that is too aggressive relative to cost of goods sold.
It is important to note that gross margin percentage and gross profit dollars are not the same optimization target. A store running 42% margin at a $70 average basket generates more gross profit per customer than a store running 50% margin at a $50 average basket. We recommend tracking both metrics in parallel rather than optimizing margin percentage in isolation.
Steep discounts in the 45 to 50 percent range can trigger a quality perception problem with cannabis customers. When a product is discounted that aggressively, a portion of shoppers will interpret the discount as a signal that the product is expiring, defective, or unpopular rather than as a genuine deal. This is especially true for products that do not carry strong brand recognition with that customer base.
The second problem is margin destruction on loyal customers. BudMetrics data consistently shows that 30 to 40 percent of a dispensary’s customer base are habitual repeat buyers who would purchase at full price regardless of the promotion. Running store-wide steep discounts on high-traffic days like Fridays hands margin away to exactly these customers, inflating the discount cost with no incremental revenue to show for it. AI-driven discount tools help operators find the effective range that attracts occasional buyers without discounting the loyal customer base.
Based on BudMetrics data from its initial store cohort, a dispensary generating $150,000 per month in gross profit with 1,300 SKUs and unmanaged slow movers was losing an estimated $15,000 to $20,000 per month in recoverable gross profit. That figure includes margin lost on expired products that became write-offs, cash tied up in backstock that was not generating any return, and missed floor revenue from products that would have sold if they had been surfaced and promoted.
The $15,000 to $20,000 estimate is conservative for a store of that revenue size. Larger operators with higher SKU counts and more complex backstock situations typically face proportionally higher losses. The recoverable portion, the amount that an automated inventory management system can realistically recover, varies based on how deeply the slow-mover problem has compounded, but we consistently see meaningful improvement within the first 60 to 90 days of active management.
Ready to Stop Leaving Gross Profit on the Table?
Most dispensaries we work with have at least one significant, fixable leak in their operations. Whether it is slow-mover inventory, discount strategy, pricing calibration, or purchase optimization, we usually identify the gap in the first conversation. GreenGrowth CPAs works with cannabis retailers across California, New York, New Jersey, Minnesota, and Delaware on financial strategy, CFO infrastructure, and 280E compliance.
Book a Free Cannabis Business Review →Learn About Our Services
KEY NUMBERS
Let’s Find Your Margin Leak
Most cannabis retailers have at least one significant, fixable gap in their operations. We spot it in the first conversation. Schedule a free review with the GreenGrowth CPAs team today.
Book Your Free Cannabis Business Review →GreenGrowth CPAs · Cannabis Operations & Technology Team
Get more GreenGrowth CPAs insights in Google Search and AI Mode.