So much is happening in your cannabis business at all times, and there’s always something operators should be worried about, right? Especially when it comes to cash flow problems and determining how to generate positive revenue for the business.
What’s generating revenue? What new promotions are you rolling out, which costs are increasing and why?
And not to mention, the need to stay up to date with market trends and new product roll-outs. It can be hectic keeping track of it all!
At the end of all this activity, you do see some financial results, but what do they mean?
A monthly P&L is a dot, a snapshot of performance over a certain period of time. As you begin to analyze the data over longer time frames, turning dots into lines, you can begin to see trends.
Although, it generally takes 3-6 months before you’re able to see valid trends, and depending on the seasonality, it could even take up to a year to identify trends.
As time progresses further, you’re then able to take the extra “noise” out of the high and low months. You’re also able to identify holiday weekends and other seasonal events that can skew results.
This is when you begin to see a true average performance of the business and where your money REALLY goes.
However, the constant needs of a competitive market draw big questions.
Many operators are asking how they can improve?
And the data is so cumbersome, that they are often unsure about where to focus their efforts to ultimately end up with more money at the end of the year.
Solution to your problems!
Don’t just read your financials…Analyze them!
Compare them with industry averages and run a scenario analysis to help understand how adjusting different financial levers can impact your financial performance.
And finally, after finding a proper strategy, you’re able to build out a forecast for the subsequent periods, and get to work on executing your plans.
Should you focus on revenue growth or margin improvement?
We get this question all the time! Where should I focus? On growing my overall revenue or improving my margins?
First, it’s important to remember that every business is different in many ways. And it’s impossible to give a consistent answer for EVERY company.
That’s why the short answer is, “It Depends”. I know that’s probably not what you wanted to hear, but it’s the truth! It depends on your stage of business, exit plans, current performance, and many other factors.
Now, with cannabis being a commodity business, it is very important to hit scale quickly, maximize your capacity, and focus on keeping a grip on margins.
And while huge pops in revenue are exciting (I mean come on, we all want and love more sales), consistent growth creates financial stability. Steady increases in profits helps you develop a more sustainable business that can withstand the test of time.
Either way, with fast revenue growth or slow and steady, if you’re adding more revenue to a business that has terrible margins, then that is like adding water to a bucket with holes in it.
Focusing on the financial health metrics, such as gross profit margins, are critical so that your efforts to increase revenue are not done in vain.
Now getting back to the question at hand, what should you focus on…revenue growth or margin improvement?
We can take the guesswork out of the decision by running a scenario analysis vs your actual performance. Through this financial analysis, we can find a best answer, number-wise.
Let’s review an example.
Example 1
Review Last Year’s Annual P&L
First, let’s see how you performed last year.
To do this, have your CFO run your numbers through the accounting system and produce a P&L (Profit and Loss) statement.

The image above shows a 1-year profit and loss statement for an imaginary cannabis dispensary that started last year in April.
Here’s a few key numbers to note:
- Revenue is just over $1.2MM for the first year in business
- CoGS came in at $1.1MM, which equates to about 92% of total revenue
- Additional expenses totaled $153k or 13% of revenue
- Net income was -$60M
Out of all these figures, what’s the main one that jumps out at you?
There may be a few, but one of the main numbers we should be immediately concerned about is the CoGS (cost of goods sold).
92% of sales, yikes!
Either they are running some sort of tax evasion scheme by putting everything into CoGS or more than likely, they’ve never run a retail business and are purchasing way too much product!
To compound matters further, they are probably experiencing problems moving merchandise and may not be marking it up properly as well.
What Should CoGS Be?
Let’s level-set and go over the industry average for CoGS.
In the cannabis space, you want to try and maintain a CoGS percentage of 50% ±5%. Keep in mind, there will be some higher and lower months where the percentage may change to reflect a variety of factors.
Here’s a common problem we see with CoGS: If you’re serving a client-base that is heavily focused on and sensitive to price, then you have two main approaches to buying product.
- You buy cheaper, lower quality product, and mark it up correctly (this = healthy margins)
OR
- You buy good product and don’t mark it up as much (this = suffering margins)
The goal in these types of situations is to find a healthy mix between different products which helps you optimize CoGS.
In any instance, you should be marking up your costs by 100%. That’s right! Essentially, this will double your money (in gross terms) each time.
For example, if you’re purchasing flower for $10, then sell it for $20. This is a normal practice in retail and keeps you competitive with industry standards. And it gives you the ability to cover all the other overhead costs that come with running your business.
Financial Modeling & Forecasting
Running a Scenario Analysis
Let’s simply change a few numbers to illustrate two scenarios: 1) improving margins vs 2) improving revenue & margins at the same time, see how things flow through the P&L, and then compare results.
Note: For both scenarios below, we annualized out the final revenue from the above P&L to get a base $1.6MM in full year revenue.
Scenario 1: Adjust Gross Profit Margins Only
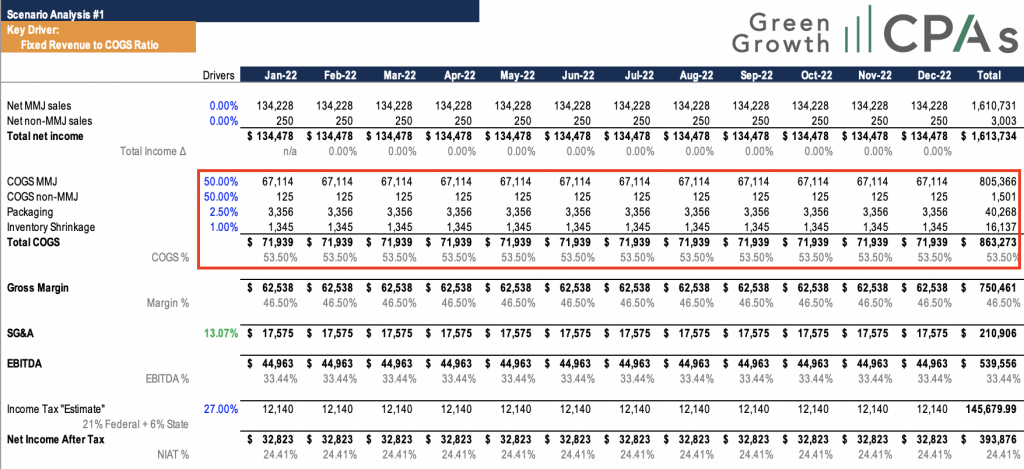
In this example, all we did was change the CoGS to 53.5% (relatively industry standard).
CoGS Breakdown:
- 50% for the products
- 2.5% for packaging
- 1% for inventory shrinkage
We kept everything else the same, ran the numbers and saw drastic impacts in comparison to the first example P&L.
Impact of Scenario 1:
- Gross margin improved from 8% to 46.5% (nearly 6x better!)
- EBITDA increased from -$60k to +$540k
- Net income after tax from -$61k to +$394k
- NIAT% went from negative to +24.41%
Nice! Let’s look at another option.
Scenario 2: Adjust Gross Margins + Increase Marketing and Sales
In this second round, we made the same changes to CoGS as we did in Scenario 1, keeping them at 53.5%.
We also increased the marketing budget from .5% to 2.5%, and to account for the increase in marketing expenses, we increased the sales projections by 5%.
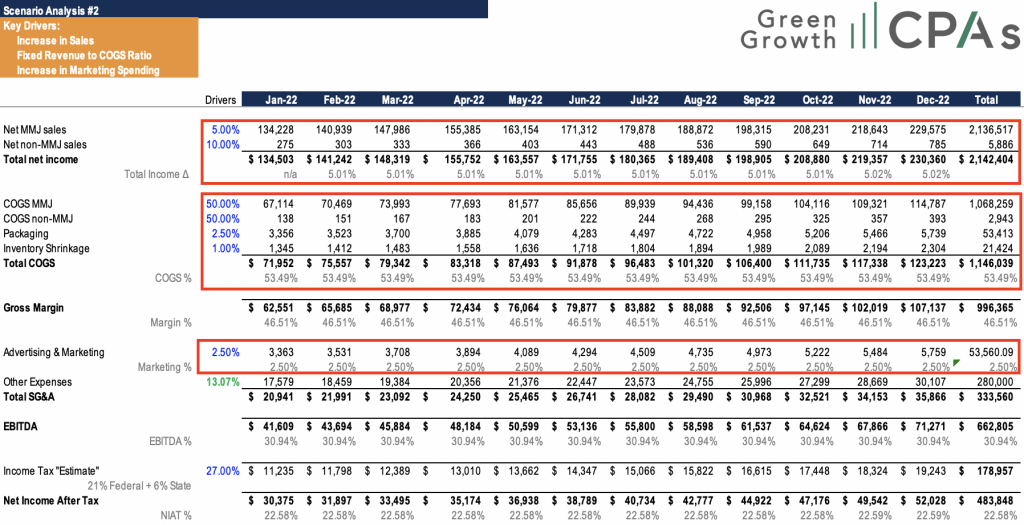
Impacts of Scenario 2:
- Revenue improved by 5%
- CoGS again are optimized which means gross margins improved
- And EBITDA increased as well as net income after tax in terms of total dollars
Conclusion
Obviously, either of these two scenarios are much better than the current position the company is operating under. And after reviewing both scenarios, you can see the impact of each strategy.
At first glance, you see the bigger aggregate numbers, higher sales, higher profits of scenario 2, and you’re like, sign me up!
But let’s analyze this a little deeper.
Yes, we would all love to have more revenue coming in, but keeping the revenue is most important, right!
And with scenario 2, this is assuming that the marketing does have a material impact to increase revenue by 5%, which is not always the case.
So, when you analyze the margins (scenario 1 vs. scenario 2), here’s what you find:
- EBITDA = 33.44% v. 30.94%
- NIAT = 24.41% v. 22.59%
The margins are MUCH better in scenario 1 than scenario 2.
And what you can see is that just by working on improving the CoGS percentage, this business would be able to unlock MUCH better EBITDA and NIAT as a percentage of revenue.
This seems more attainable since it’s simply just the discipline of upping the prices or reducing procurement costs. Each business is different and will have a balance of these two strategies and more to combat margin compression.
It takes a concerted effort to do just CoGS optimization, so to think you can do both is a large stretch, but that depends on your team, of course.
In the case of this new dispensary going into its second year, it’s most likely best to just forecast and execute Scenario #1 by focusing on gross margin improvement with CoGS optimization before spending any additional money on growing revenue.
Get your Business Analysis Today!
To learn more about optimizing your business operations management and other potential revenue scenarios, reach out to our team of financial experts at GreenGrowth CPAs. We are here to help your cannabis venture through any level of the accounting, tax filing, or business cycle.
We employ several financial programs to assist the company with its fiscal responsibilities, including tax planning and compliance, outsourced CFO support, audit preparation, tax controversy support, and much more.
For recommendations and assistance with tax planning and accounting services, schedule a free consultation or contact us at 1-800-674-9050.